Background
There comes a time when you need to measure the output (markings) of your K40 with a known pattern in an accurate and repeatable way. This post focuses on tools to do just that.
Donate:
Please consider donating (button to the right of this post).
Your donations help fund additional research, tools and parts that I will return to the community as information.
Laser Marking Measurement Magnifier
This loop (not sure this one comes with the reticle) was acquired while I was developing laser printers. These magnifiers have optics and a removable reticle. The reticle in this loop allows you to measure lines spaces, line weights and spots.Although this magnifier is nice because it has a reticle designed for measuring graphics art any magnifier with a graticule could be used and the phone table design adapted.
Some Other Magnifier Sources
- https://www.tedpella.com/magnify_html/magnifier.htm
- https://www.emsdiasum.com/microscopy/products/magnifier/measuring.aspx
- https://www.edmundoptics.com/microscopy/magnifiers/handheld-magnifiers/peak-7x-or-10x-measuring-loupes/1782/
Phone Holder Table
I wondered if I could get good quality photos from my phone (S7active) laying on top of the magnifier which is below a fixed FL table.Answer: Yes!.
I designed a simple table from acrylic that can be of course cut on your K40.
 |
| Table with LED light source (HF). Phone sits on top. |
Measurements Photos

 |
| 1 line on 2 lines off pattern. Measured output of laser printer |
Marking Test Patterns
The most critical part of this tool is of course the pattern. The pattern was created in Inkscape as vectors. Vectors were drawn at the pixel level to create various resolution patterns in horizontal, vertical and diagonal directions. Line patterns with alternating line weights and spaces are used to test the systems response and the edges of these patterns when vector drawn and raster-ized can easily show errors. Some measurement values in mm are included on the pattern for reference.
Pattern labels: the patterns are labeled with line and space values that indicate line and space values respectively [line&space]. Example: 1&2 = "one line width* ON and 2 line widths OFF.
* Line Widths are relative to the images resolution in this case SVG resolution or 90.07dpi. Also note that the resolution of Inkscape can change as its version changes.
The .svg file is Resolution Test Pattern. I will keep it updated as I improve the patterns.
This file can be used in at least two ways and in any position(s) on the work-space:
- Download convert to Gcodes in your favorite CAM tool, I use LaserWeb. Then print this file on the test material subsequently measuring the image artifacts to insure that line width, position, spacing and edge acuity is correct. This tests vector marking.
- Save the .svg file as a .jpg and convert the image to a raster scan Gcodes in your favorite CAM tool, I use LaserWeb. Then print this file on the test material subsequently measuring the image artifacts to insure that line width, position, spacing and edge acuity is correct. This tests raster scan marking.
 |
| Picture courtesy of and marked by +Chris Menchion |
 |
| Picture courtesy of and marked by +Chris Menchion |
 |
| A micrometer will work accurately if you measure across multiple strokes. Picture courtesy of and marked by +Chris Menchion |
Diagnostics
This tool should be able to show errors caused by optics, electronics and mechanisms:
- Errors in vector moves: "Positions, distance and start stop accuracy".
- Raster scan synchronization from scan to scan: "Edge wiggling".
- Resolution errors: "Lines not spaced properly"
- Dot size adjustment errors: "Vector lines should create close to an even black fill if the spot size is correct"
The source of different errors can be isolated by comparing vector vs image marking of the same pattern.
Example: vertical "wiggling" is noticed when marking. If there is no vertical "wiggling" on vector vertical strokes but there is on image vertical strokes this may indicate that there is a problem when the gantry reverses its horizontal motion. In the vector case the stroke is drawn vertically in one move. In the raster case the stroke is drawn by placing one dot under the other on each scan. When the gantry is scanning it marks a dot going right moves down a scan and then marks a dot going the other direction. Maybe a loose X stepper belt or its pulley?
Optimization
 This tool should help in optimizing for materials!
Marking quality with a laser has inherently two challenges:
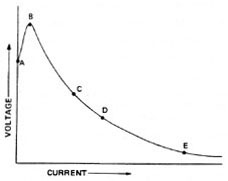
- The power in a laser beam is Gaussian distributed with less power at its perimeter than in the middle. Therefore when two perfectly placed lines are marked parallel to each other the lower energy at the edge results in lower surface exposure and a banding effect** can be seen. This uneven power characteristic of lasers complicates the selection of beam size. Increasing the spot or power can reduce the uneven exposure due to overlay, but at the cost of resolution.
- From material to material exposure (how it burns) characteristics can vary widely. What darkly marks one material at a certain speed, spot size and power may not even mark another material at all. In the case of wood moisture content can even cause differences in the same wood type.
 |
| A Simplified Explanation of Exposure |
** Banding can be caused from multiple types of errors in the system, including exposure, optical, electronic positioning and mechanical instabilities.
This tool will help with optimization by making it easier to measure position, line weights, spot sizes while viewing their effect on the visual appearance of the pattern.
Enjoy and comment,
Don